hist.numpy module#
- hist.numpy.histogram(a: object, bins: int | str | NDArray[Any] = 10, range: tuple[float, float] | None = None, normed: None = None, weights: object | None = None, density: bool = False, *, histogram: None | type[Histogram[Any]] = None, storage: Storage | None = None, threads: int | None = None) Any#
- Return a boost-histogram object using the same arguments as numpy’s histogram.
This does not support the deprecated normed=True argument. Three extra arguments are added: histogram=bh.Histogram will enable object based output, storage=bh.storage.* lets you set the storage used, and threads=int lets you set the number of threads to fill with (0 for auto, None for 1).
Compute the histogram of a dataset.
- Parameters:
a (array_like) – Input data. The histogram is computed over the flattened array.
bins (int or sequence of scalars or str, optional) –
If bins is an int, it defines the number of equal-width bins in the given range (10, by default). If bins is a sequence, it defines a monotonically increasing array of bin edges, including the rightmost edge, allowing for non-uniform bin widths.
If bins is a string, it defines the method used to calculate the optimal bin width, as defined by histogram_bin_edges.
range ((float, float), optional) – The lower and upper range of the bins. If not provided, range is simply
(a.min(), a.max()). Values outside the range are ignored. The first element of the range must be less than or equal to the second. range affects the automatic bin computation as well. While bin width is computed to be optimal based on the actual data within range, the bin count will fill the entire range including portions containing no data.weights (array_like, optional) – An array of weights, of the same shape as a. Each value in a only contributes its associated weight towards the bin count (instead of 1). If density is True, the weights are normalized, so that the integral of the density over the range remains 1. Please note that the
dtypeof weights will also become thedtypeof the returned accumulator (hist), so it must be large enough to hold accumulated values as well.density (bool, optional) – If
False, the result will contain the number of samples in each bin. IfTrue, the result is the value of the probability density function at the bin, normalized such that the integral over the range is 1. Note that the sum of the histogram values will not be equal to 1 unless bins of unity width are chosen; it is not a probability mass function.
- Returns:
hist (array) – The values of the histogram. See density and weights for a description of the possible semantics. If weights are given,
hist.dtypewill be taken from weights.bin_edges (array of dtype float) – Return the bin edges
(length(hist)+1).
See also
histogramdd,bincount,searchsorted,digitize,histogram_bin_edgesNotes
All but the last (righthand-most) bin is half-open. In other words, if bins is:
[1, 2, 3, 4]
then the first bin is
[1, 2)(including 1, but excluding 2) and the second[2, 3). The last bin, however, is[3, 4], which includes 4.Examples
>>> import numpy as np
>>> np.histogram([1, 2, 1], bins=[0, 1, 2, 3])
(array([0, 2, 1]), array([0, 1, 2, 3]))
>>> np.histogram(np.arange(4), bins=np.arange(5), density=True)
(array([0.25, 0.25, 0.25, 0.25]), array([0, 1, 2, 3, 4]))
>>> np.histogram([[1, 2, 1], [1, 0, 1]], bins=[0,1,2,3])
(array([1, 4, 1]), array([0, 1, 2, 3]))
>>> a = np.arange(5)
>>> hist, bin_edges = np.histogram(a, density=True)
>>> hist
array([0.5, 0. , 0.5, 0. , 0. , 0.5, 0. , 0.5, 0. , 0.5])
>>> hist.sum()
2.4999999999999996
>>> np.sum(hist * np.diff(bin_edges))
1.0
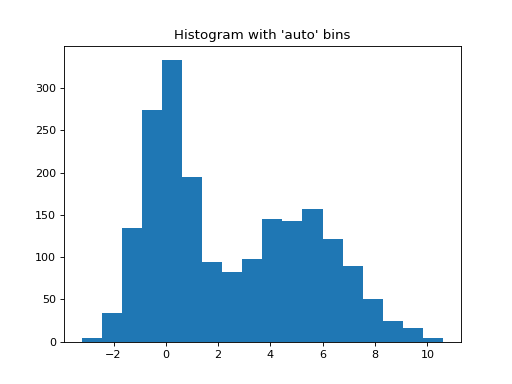
Automated Bin Selection Methods example, using 2 peak random data with 2000 points.
import matplotlib.pyplot as plt
import numpy as np

rng = np.random.RandomState(10)  # deterministic random data
a = np.hstack((rng.normal(size=1000),
               rng.normal(loc=5, scale=2, size=1000)))
plt.hist(a, bins='auto')  # arguments are passed to np.histogram
plt.title("Histogram with 'auto' bins")
plt.show()
(
Source code,png,hires.png,pdf)
- hist.numpy.histogram2d(x: object, y: object, bins: int | tuple[int, int] = 10, range: None | Sequence[None | tuple[float, float]] = None, normed: None = None, weights: object | None = None, density: bool = False, *, histogram: None | type[Histogram[Any]] = None, storage: Storage = Double(), threads: int | None = None) Any#
- Return a boost-histogram object using the same arguments as numpy’s histogram2d.
This does not support the deprecated normed=True argument. Three extra arguments are added: histogram=bh.Histogram will enable object based output, storage=bh.storage.* lets you set the storage used, and threads=int lets you set the number of threads to fill with (0 for auto, None for 1).
Compute the bi-dimensional histogram of two data samples.
- Parameters:
x (array_like, shape (N,)) – An array containing the x coordinates of the points to be histogrammed.
y (array_like, shape (N,)) – An array containing the y coordinates of the points to be histogrammed.
bins (int or array_like or [int, int] or [array, array], optional) –
The bin specification:
If int, the number of bins for the two dimensions (nx=ny=bins).
If array_like, the bin edges for the two dimensions (x_edges=y_edges=bins).
If [int, int], the number of bins in each dimension (nx, ny = bins).
If [array, array], the bin edges in each dimension (x_edges, y_edges = bins).
A combination [int, array] or [array, int], where int is the number of bins and array is the bin edges.
range (array_like, shape(2,2), optional) – The leftmost and rightmost edges of the bins along each dimension (if not specified explicitly in the bins parameters):
[[xmin, xmax], [ymin, ymax]]. All values outside of this range will be considered outliers and not tallied in the histogram.density (bool, optional) – If False, the default, returns the number of samples in each bin. If True, returns the probability density function at the bin,
bin_count / sample_count / bin_area.weights (array_like, shape(N,), optional) – An array of values
w_iweighing each sample(x_i, y_i). Weights are normalized to 1 if density is True. If density is False, the values of the returned histogram are equal to the sum of the weights belonging to the samples falling into each bin.
- Returns:
H (ndarray, shape(nx, ny)) – The bi-dimensional histogram of samples x and y. Values in x are histogrammed along the first dimension and values in y are histogrammed along the second dimension.
xedges (ndarray, shape(nx+1,)) – The bin edges along the first dimension.
yedges (ndarray, shape(ny+1,)) – The bin edges along the second dimension.
See also
histogram1D histogram
histogramddMultidimensional histogram
Notes
When density is True, then the returned histogram is the sample density, defined such that the sum over bins of the product
bin_value * bin_areais 1.Please note that the histogram does not follow the Cartesian convention where x values are on the abscissa and y values on the ordinate axis. Rather, x is histogrammed along the first dimension of the array (vertical), and y along the second dimension of the array (horizontal). This ensures compatibility with histogramdd.
Examples
>>> import numpy as np
>>> from matplotlib.image import NonUniformImage
>>> import matplotlib.pyplot as plt
Construct a 2-D histogram with variable bin width. First define the bin edges:
>>> xedges = [0, 1, 3, 5]
>>> yedges = [0, 2, 3, 4, 6]
Next we create a histogram H with random bin content:
>>> x = np.random.normal(2, 1, 100)
>>> y = np.random.normal(1, 1, 100)
>>> H, xedges, yedges = np.histogram2d(x, y, bins=(xedges, yedges))
>>> # Histogram does not follow Cartesian convention (see Notes),
>>> # therefore transpose H for visualization purposes.
>>> H = H.T
imshowcan only display square bins:>>> fig = plt.figure(figsize=(7, 3)) >>> ax = fig.add_subplot(131, title='imshow: square bins') >>> plt.imshow(H, interpolation='nearest', origin='lower', ... extent=[xedges[0], xedges[-1], yedges[0], yedges[-1]]) <matplotlib.image.AxesImage object at 0x...>
pcolormeshcan display actual edges:>>> ax = fig.add_subplot(132, title='pcolormesh: actual edges', ... aspect='equal') >>> X, Y = np.meshgrid(xedges, yedges) >>> ax.pcolormesh(X, Y, H) <matplotlib.collections.QuadMesh object at 0x...>
NonUniformImagecan be used to display actual bin edges with interpolation:>>> ax = fig.add_subplot(133, title='NonUniformImage: interpolated', ... aspect='equal', xlim=xedges[[0, -1]], ylim=yedges[[0, -1]]) >>> im = NonUniformImage(ax, interpolation='bilinear') >>> xcenters = (xedges[:-1] + xedges[1:]) / 2 >>> ycenters = (yedges[:-1] + yedges[1:]) / 2 >>> im.set_data(xcenters, ycenters, H) >>> ax.add_image(im) >>> plt.show()
It is also possible to construct a 2-D histogram without specifying bin edges:
>>> # Generate non-symmetric test data
>>> n = 10000
>>> x = np.linspace(1, 100, n)
>>> y = 2*np.log(x) + np.random.rand(n) - 0.5
>>> # Compute 2d histogram. Note the order of x/y and xedges/yedges
>>> H, yedges, xedges = np.histogram2d(y, x, bins=20)
Now we can plot the histogram using
pcolormesh, and ahexbinfor comparison.>>> # Plot histogram using pcolormesh >>> fig, (ax1, ax2) = plt.subplots(ncols=2, sharey=True) >>> ax1.pcolormesh(xedges, yedges, H, cmap='rainbow') >>> ax1.plot(x, 2*np.log(x), 'k-') >>> ax1.set_xlim(x.min(), x.max()) >>> ax1.set_ylim(y.min(), y.max()) >>> ax1.set_xlabel('x') >>> ax1.set_ylabel('y') >>> ax1.set_title('histogram2d') >>> ax1.grid()
>>> # Create hexbin plot for comparison
>>> ax2.hexbin(x, y, gridsize=20, cmap='rainbow')
>>> ax2.plot(x, 2*np.log(x), 'k-')
>>> ax2.set_title('hexbin')
>>> ax2.set_xlim(x.min(), x.max())
>>> ax2.set_xlabel('x')
>>> ax2.grid()
>>> plt.show()
- hist.numpy.histogramdd(a: tuple[object, ...], bins: int | tuple[int, ...] | tuple[NDArray[Any], ...] = 10, range: None | Sequence[None | tuple[float, float]] = None, normed: None = None, weights: object | None = None, density: bool = False, *, histogram: None | type[Histogram[Any]] = None, storage: Storage = Double(), threads: int | None = None) Any#
- Return a boost-histogram object using the same arguments as numpy’s histogramdd.
This does not support the deprecated normed=True argument. Three extra arguments are added: histogram=bh.Histogram will enable object based output, storage=bh.storage.* lets you set the storage used, and threads=int lets you set the number of threads to fill with (0 for auto, None for 1).
Compute the multidimensional histogram of some data.
- Parameters:
sample ((N, D) array, or (N, D) array_like) –
The data to be histogrammed.
Note the unusual interpretation of sample when an array_like:
When an array, each row is a coordinate in a D-dimensional space - such as
histogramdd(np.array([p1, p2, p3])).When an array_like, each element is the list of values for single coordinate - such as
histogramdd((X, Y, Z)).
The first form should be preferred.
bins (sequence or int, optional) –
The bin specification:
A sequence of arrays describing the monotonically increasing bin edges along each dimension.
The number of bins for each dimension (nx, ny, … =bins)
The number of bins for all dimensions (nx=ny=…=bins).
range (sequence, optional) – A sequence of length D, each an optional (lower, upper) tuple giving the outer bin edges to be used if the edges are not given explicitly in bins. An entry of None in the sequence results in the minimum and maximum values being used for the corresponding dimension. The default, None, is equivalent to passing a tuple of D None values.
density (bool, optional) – If False, the default, returns the number of samples in each bin. If True, returns the probability density function at the bin,
bin_count / sample_count / bin_volume.weights ((N,) array_like, optional) – An array of values w_i weighing each sample (x_i, y_i, z_i, …). Weights are normalized to 1 if density is True. If density is False, the values of the returned histogram are equal to the sum of the weights belonging to the samples falling into each bin.
- Returns:
H (ndarray) – The multidimensional histogram of sample x. See density and weights for the different possible semantics.
edges (tuple of ndarrays) – A tuple of D arrays describing the bin edges for each dimension.
See also
histogram1-D histogram
histogram2d2-D histogram
Examples
>>> import numpy as np
>>> rng = np.random.default_rng()
>>> r = rng.normal(size=(100,3))
>>> H, edges = np.histogramdd(r, bins = (5, 8, 4))
>>> H.shape, edges[0].size, edges[1].size, edges[2].size
((5, 8, 4), 6, 9, 5)